
One of the tools I’m using already quite a while to profile memory usage is the built-in profiling functionality in glibc. For some reason this isn’t known very much, so I thought documenting it here makes sense, so I can simply point the people to this post, instead of explaining everything ;-)
What does glibc support?
- Detecting mem leaks
- Printing a memory histogram
- Plotting a graph of memory usage over time
- Measuring not only the heap, but also stack usage
- Works also for embedded system which use glibc, not only on the PC
How does it work?
The functionality is implemented in a library called libmemusage.so, which
gets preloaded by the dynamic linker simply be defining the variable LD_PRELOAD=/lib64/libmemusage.so.
The path may vary depending on the system you use of course.
Example:
LD_PRELOAD=/lib64/libmemusage.so ./helloworld
You can configure where the profile output is store by exporting the variable MEMUSAGE_OUTPUT=profile.dat.
There exists also a convenience wrapper script named memusage which does
all this for you. A second program called memusagestat can generate nice
graphics from the profiling data. Normally this scripts doesn’t get installed
with glibc and must be installed separately.
Gentoo: compile glibc with ‘gd’ use flag
Debian: libc6-dbg contains /usr/lib/debug/lib/x86_64-linux-gnu/libmemusage.so, but the scripts are missing On other systems you may find a package called glibc-utils which contain the scripts. As a last resource you can download it from [https://www.gnu.org/software/libc].
Now lets see this in action: There for I created a simple example application, which allocated memory and creates one memory leak.
#include <stdio.h>
#include <malloc.h>

int main(int argc, char *argv[])
{
    int i;
    void *data[10];

    printf("Hello World\n");

    for (i = 0; i < 10; ++i) {
        data[i] = malloc(i+10);
    }

    for (i = 0; i < 9; ++i) {
        free(data[i]);
    }

    return 0;
}
Compile it like this: gcc -o hello hello.c
And run it using memusage
$> memusage ./hello
Hello World

Memory usage summary: heap total: 1169, heap peak: 1169, stack peak: 656
         total calls   total memory   failed calls
 malloc|         11           1169              0
realloc|          0              0              0  (nomove:0, dec:0, free:0)
 calloc|          0              0              0
   free|          9            126
Histogram for block sizes:
    0-15              6  54% ==================================================
   16-31              4  36% =================================
 1024-1039            1   9% ========
As you can see there are 11 malloc calls, 10 from our code, 1 from printf, and only 9 frees, so we have found a memory leak. We can also see the memory distribution in the histogram and in the summary we can see the heap and stack peak values.
Now lets do the same thing again and lets plot a memory usage chart.
$> memusage -d profile.dat ./hello
$> memusagestat -o profile.png profile.dat
This creates the following graphics:
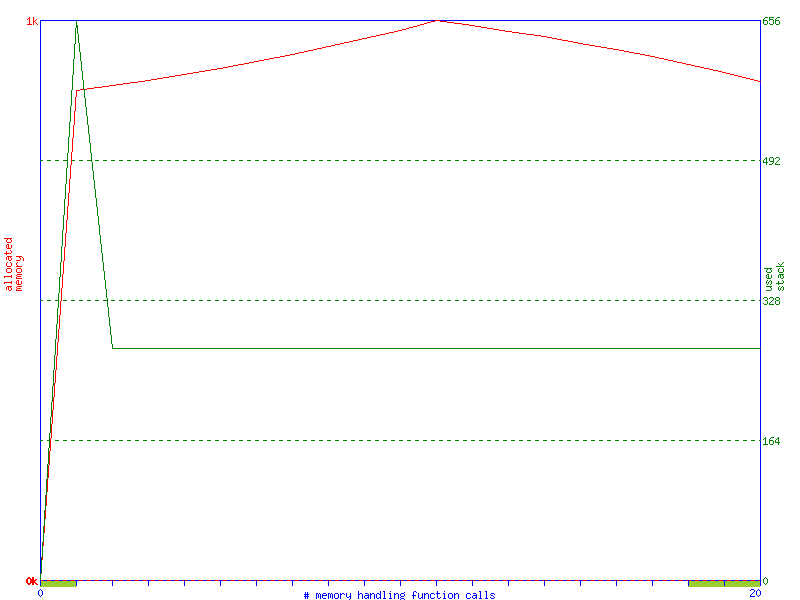
Of course this is a little boring in this simple application, but is very useful in bigger applications. For detecting memory leaks are better solutions available like valgrind, but this chart is very useful to see how much memory an application needs at what time, event though no memory leaks exists. E.g. consistently growing memory usage would be a problem.
How to use this on embedded devices?
In most cross-compiler toolchains that use glibc the library libmemusage.so does exist also. You can use this on the embedded system by SSHing into the system and using the LD_PRELOAD approach even though the convenience wrapper scripts are not available there usually. Then you copy back the results to your PC using SSH and generate the plot on the PC using memusagestat.
Comments
comments powered by Disqus