
There exists more than one type of memory leaks with different effects and different way to detect them:
- The typical memory leak: a piece of memory the gets allocated but is not freed anymore. This is the classic type of memory leak, for what C and C++ gets blamed for all the time. This is very easy to detect by tools like valgrind, GCC address sanitizer and so on. These tools report you where exactly the leaked memory was allocated with file name and line number.
- The cyclic memory leak that gets cleaned when the application exits: This leak will not get reported by the tools mentioned above, because the data actually does not leak. But the memory usage grows and grows until you reach an out-of-memory error, which often leads to application crashes. The tricky part with this type of error is, a garbage collector like in JAVA and .Net does not help, because the memory is still referenced. This often occurs because new data is inserted into a container class (e.g. list), but gets never removed due to a logic error. When the application terminates and the list gets cleaned all contained objects get freed too, hence there is no memory leak.
JAVA Example Pseudo Code:
import java.util.*;

...

ArrayList<Contact> Contacts = new ArrayList<Data>();

void some_periodic_function()
{
    // memory grows and grows, GC will remove the memory though,
    // but only when the application shuts down
    Contacts.add(new Contact(Name, Lastname));
}
C++ Example Pseudo Code:
#include <list>
using namespace std;

...
list<Contact*> Contacts;

void some_periodic_function()
{
    // memory grows and grows, cleanup will remove the memory though,
    // but only when the application shuts down
    Contacts.add(new Contact(Name, Lastname));
}

void cleanup()
{
    list<Contact*>::iterator it;

    for (it = Contacts.begin(); it != Contacts.end(); ++it) {
        delete(*it);
    }
    Contacts.clear();
}
How can we detect such leaks?
Often developers or testers are using tools like TaskManager (on Windows), or top (on Linux), but these tools are very inaccurate and only useful when memory grows very fast very high.
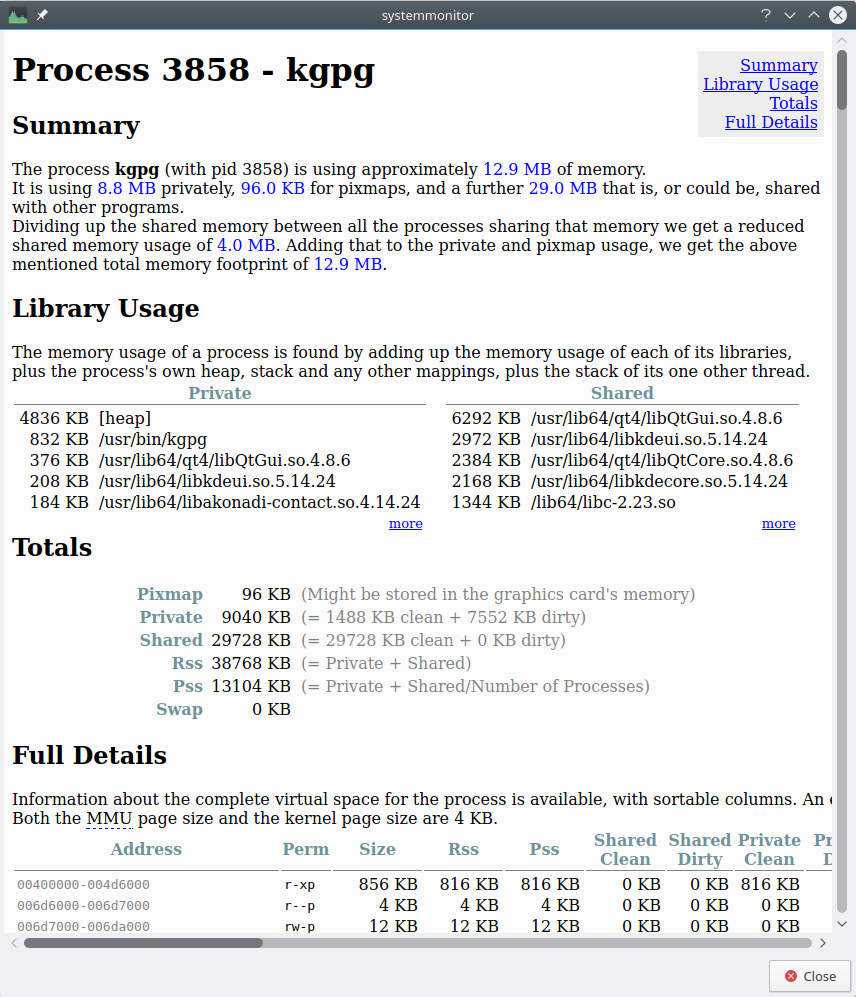
Another problem with these tools is that people are looking on the wrong data. Frequently customers reported memory leaks because they saw Virtual memory increasing but not shrinking anymore. In the virtual address space of a process on the PC we often see huge virtual memory usage, because this includes all shared libraries mapped into our address space (and more), often with huge gaps in between. You can see this in detail in the process’s memory map. This is not the application’s memory usage! The Rss field shows us the private memory + shared memory, which is just a part of the virtual address space, but still there is the shared memory part. When we subtract SHM from RSS we get the pure Private memory of the process, which contains the Code of the executable, the stack and the heap. I recommend to have a look at KDE’s “Detailed Memory Information” dialog in the System Monitor to get a better overview on this.
There is a better way!
Anyway as a developer you are interested in finding your memory leaks, which
are in the heap normally. On Linux there is great tool which is part of glibc
which you can use to monitor every malloc(), calloc(), realloc(),
free(), and trace this info into a file and plot a graph where you can
inspect the memory usage over time. This tool is called memusage and is one
of the easiest and best ways to get detailed information about memory usage.
Please have a look on this article for more information on memusage.
Why does the memory not shrink anymore?
This is also often asked by people using top. The heap is maintained by the glibc and starts with a certain size, when you are allocating memory glibc may need to get more memory from the operating system using the sbrk (see man 2 sbrk) system call. This way the heap in your process gets increased. When you free memory, you give this memory back to glibc’s heap, but glibc will not give this back to the OS. For this reason the heap, which is part of RSS will never shrink.
Comments
comments powered by Disqus